User Guide
Working with SDV3™
Overview
SDV3™ is a dashboard showing the Value, Volume, and Vulnerability of your sensitive data sorted by various criteria.
-
Value:
-
A measure of each data type's value (ordinal or monetary), as set under Settings>Global Data Types.
-
You can use ordinal or monetary value per item. (This is a required setting.)
-
For value scores, see Data Type Value Scoring below. Also see Global Data Types.
-
Set your Data Type Values based on your business requirements.
-
-
Volume:
-
The total number of Asset matches identified as the result of a scan.
-
Example: A scan discovers 8,000 social security numbers in various locations across your environment
-
-
The "Type" and/or "Category" of scan can be used to manage Volume and mitigate risk.
-
-
Vulnerability:
-
Vulnerability is a reflection of an Asset's security posture.
-
The "Security Measures" applied to an asset as part of your organization's security requirements reduce Vulnerability, down from 100 on a scale of 100 to 0.
-
Risk Valuation
-
A valuation of risk is displayed in the dashboard
-
This valuation shows how vulnerable your environment is in any particular data asset
-
-
Data Type Scoring
-
See Data Type Value Scoring below for value settings.
-
-
Risk Valuation - What is acceptable?
-
Your business requirements determine what is and what is not an acceptable valuation.
-
Data Type Value Scoring
-
(Ordinal) scale ranges from 0 (no risk) to 300 (very high risk).
-
Monetary scale (in dollars) default values are taken from various reports such as the IBM data breach report, Gartner, and Ponemon.
-
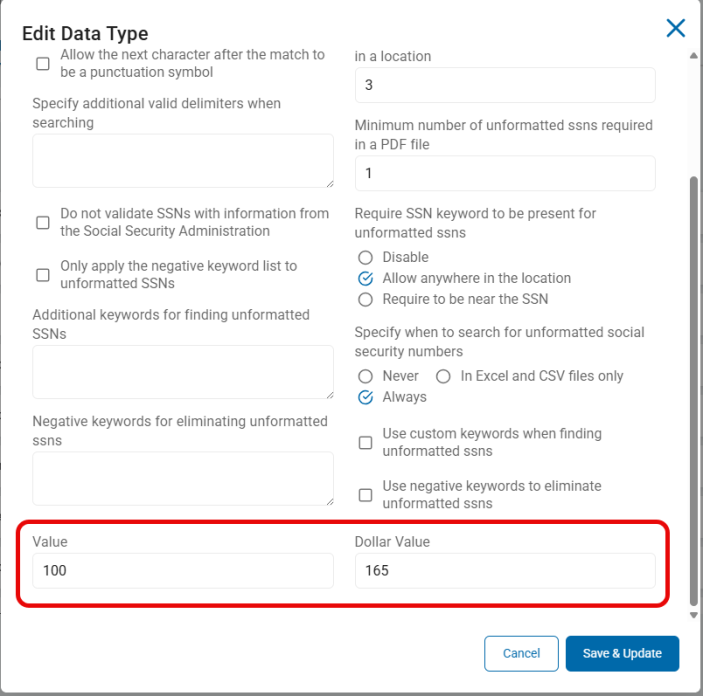
For example, the Social Security Number Data Type is set to a dollar value of 165 ($165.00 per SSN instance).
-
-
Ordinal and Monetary (in USD) values are set under Settings > Global Data Types. See below.
Data Type List - Social Security Number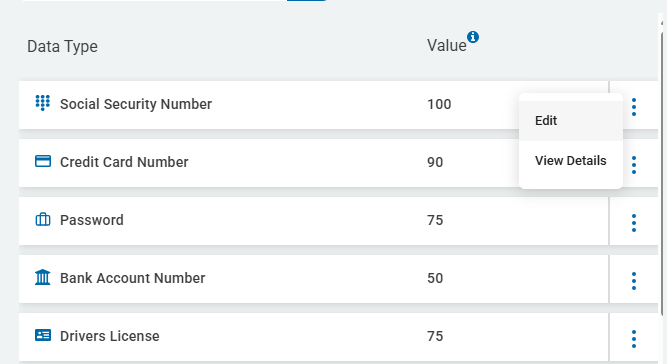
Edit Data Type - Values
Access the SDV3 Dashboard
Procedure:
-
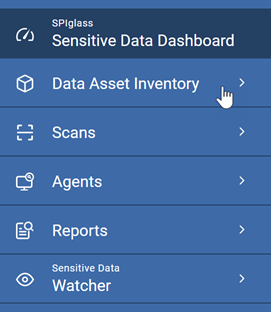
From the left menu, click Data Asset Inventory.
-
The SDV3 Dashboard displays data in three charts in ordinal or monetary values.
-
To move between value types, slide the toggle switch.

Top Data Asset Risk
-
This bar graph displays the top ten data asset risk items by the value type set.
-
Scores range from 0 (low risk) to 300 (very high risk)
-
Hover over an data asset to view the asset's SDV3 value.
-
In the example below Asset 2 shows:
-
Value - 38
-
Volume - 28
-
Vulnerability - 74
-
Risk - 140 - (38+28+74)
Asset 2 Example
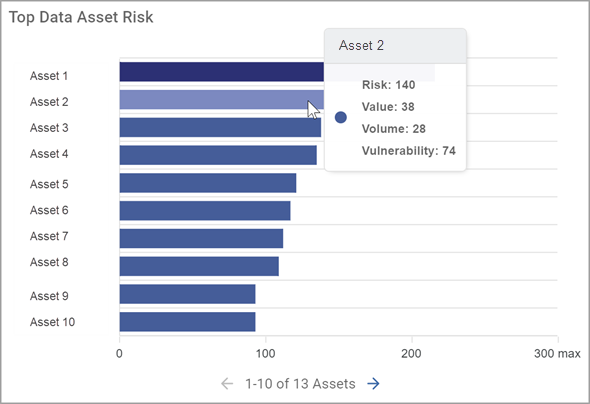
Example - Asset 2 - Monetary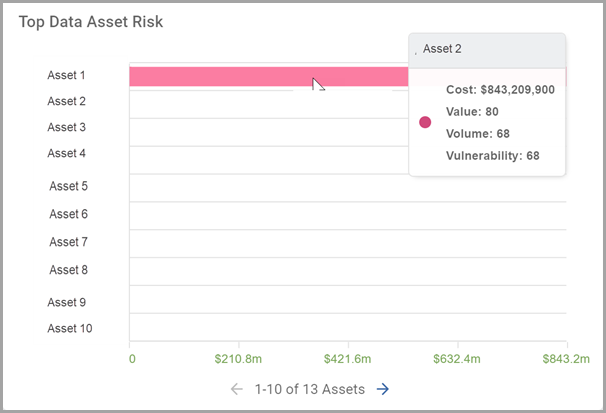
-
-
Click the right arrow to view additional Assets.

Top 10 Highest Impact Assets
-
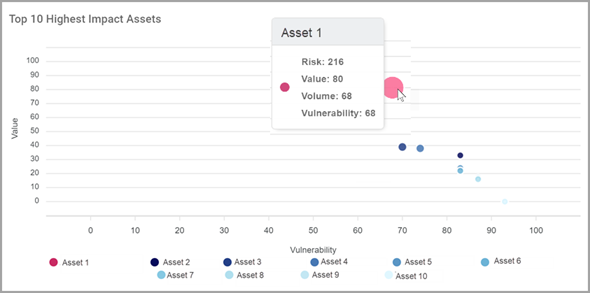
Displays the ten highest impact assets by the value type set.
-
Scores range from 0 (low impact) to 100 (high impact)
-
The y-axis (left side) measures Value
-
The x-axis (bottom) measures Vulnerability
-
Assets on the graph positioned highest and furthest to the right are vulnerable, high-risk assets that require Remediation
-
Hover over a data asset to view the SDV3 value.
Example - Asset 1 - Highest Impact Asset
Total Risk
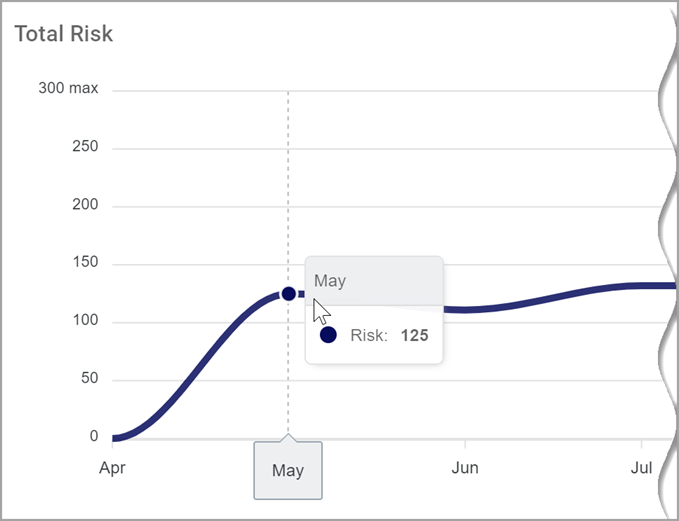
Total Risk represents the Risk score for your entire organization over time.
-
All asset risk is combined and averaged to create the Total Risk Score.
-
Score ranges from 0 (no risk) to 300 (very high risk).
-
Total Risk displays the total risk view of your data assets.
-
Total Risk rising over time is a warning that your organization's sensitive data is increasingly at risk of a data breach or other security event
-
Investigate to determine if any of the following is true:
-
Your organization has added high-risk assets without proper controls
-
Changes in your organization have resulted in existing assets no longer being subject to proper security controls
-
Changes to your IT policies (such as email or other data archiving) have caused gaps in data security
-
New personnel do not follow proper data security protocols
-
-
Take steps to keep your Total Risk score as low as possible
-
-
Hover over a data point to view the total risk score for that time period.
Note: See Example DAI Setup for sample setup instructions.
Detailed Scoring Breakdown: Value, Volume, Vulnerability
SDV3™ is a dashboard showing the Value, Volume, and Vulnerability of your sensitive data sorted by various criteria.
Below is a detailed breakdown of the calculation of the 3 V's - Value, Volume, and Vulnerability.
Value
The value of your sensitive data (data assets) is calculated using the amount and weighting of the sensitive data.
-
The number (quantity) of each asset is multiplied by its weight to yield the total value of the asset itself.
-
All asset total values are then summed to yield a Total data value, or Value score.
Example:
-
10 social security numbers (SSNs) with a weight of 10 = an SSN value of 100 (10 x 10)
-
5 credit card numbers (CCNs) with a value of 50 = 250, (5 x 50)
-
The Asset data value total = 350, (100 + 250)
-
Subsequently, the Asset Value receives a score based on the Total Asset Data Value.
-
This normalizes the number for a simpler SDV3™ Risk score.
-
Total data value (TDV) = Value score (V1)
-
Volume
Total number of matches receives a total count score which indicates the Asset's Volume.
-
The total count score is normalized in a scale of 1-100 and becomes the Asset Volume Score.
-
Total matches (TM), normalized on a score of 1-100 = Volume score (V2)
Vulnerability
An Asset's Vulnerability is measured by the Asset Type and Asset "Security Measures".
-
Each variable is given a score.
-
The values for both variables (Asset Type and Security Measures) are assigned a base score by the user in the Asset section of the Data Asset Inventory in SDP.
-
The total of these values is the Vulnerability Score (V3):
-
Asset Type (AT) + Security (SP) = Vulnerability Score (V3)
-
*All data is normalized to fit a scale of 1-100
*All data is calculated from the results of the LAST COMPLETED SCAN
